K-means from scratch
K-means is an incredibly simple algorithm, with a concepts that can easily be explained to anyone. But in order to understand something better sometimes is nice to build it from scratch. R and python both have some amazing libraries for clustering, but the beauty of K-means lies in the fact in that is so simple that its implementation can fit into a tutorial like this one.
Let’s refresh what K-means is
On Introduction to statistical learning with R is stated that:
K-means clustering is a simple and elegant approach for partitioning a data set into K distinct, non-overlapping clusters
K-means basically is to group observation based on similarity. Here are the rules to understand it:
- Centroids is almost always a value calculated based on the mean. (Except in the initial stage)
- There is K number of cluster to classify the data, usually this requires son prior knowledge.
- There is some distance that can calculate the difference between one observation and the another. (Sometimes is refer distance a similarity).
- There is no overlapping between cluster, so if an observation is in cluster A it cannot be in cluster B at the same time.
The algorithm goes as follow (From ISLR)
-
Randomly assign a number, from 1 to K, to each of the observations. These serve as initial cluster assignments for the observations.
-
Iterate until the cluster assignments stop changing
-
For each of the K clusters, compute the cluster centroid. The kth cluster centroid is the vector of the p feature means for the observations in the kth cluster
-
Assign each observation to the cluster whose centroid is closest (where closest is defined using Euclidean distance).
-
Looks doable right? Well let’s code it.
The Code in R
The distance function definition is crucial, it’s the core of K-means along with the concept of centroids. For the purpose of this example, Euclidean distance will be used, but there is no reason to not used any other distance function, in fact based on the data many times Euclidean distance may not be suitable.
  euclideanDist <- function (x,y) {
    sqrt(rowSums((x-y)^2))
  }
Super easy a one liner. Not much to see, move along.
Now the fun part of defining k-means function:
kmeans <- function(k,data,iter){}The signature reflect the three minimum requirement for kmeans.
- K number of clusters
- Data to be clustered.
- Number of iteration to run the algorithm . (This one could be optional but we need to stop at some point so is wise to use it)
Initially the centroid are pick at random, this step is one of the most important, for this implementation the selection of initial centroid will be based on any element of the data, but it does not necessarily has to be the case.
centroids = sample(nrow(data),k)Then the first iteration to initialize the observation and group them based on the randomly selected centroid
# Will keep track of which Cluster each observation belongs to
cluster = rep(0,nrow(data))
centroids_points <- rep(unname(unlist(t(data[centroids,]))), nrow(data) )
dim(centroids_points) <- c(length(unlist(data[centroids,])),nrow(data))
centroids_points <- as.data.frame(t(centroids_points))
from <- seq(1,k*p,p)
distances <- matrix(rep(0,k*nrow(data)),ncol=2)
for(i in 1:k) {
to <- i*p
distances[,i] <- euclideanDist(data,centroids_points[from[i]:to])
}
for(i in 1:k) {
cluster[which(distances[,i]==apply(distances,1,min))]<-i
}
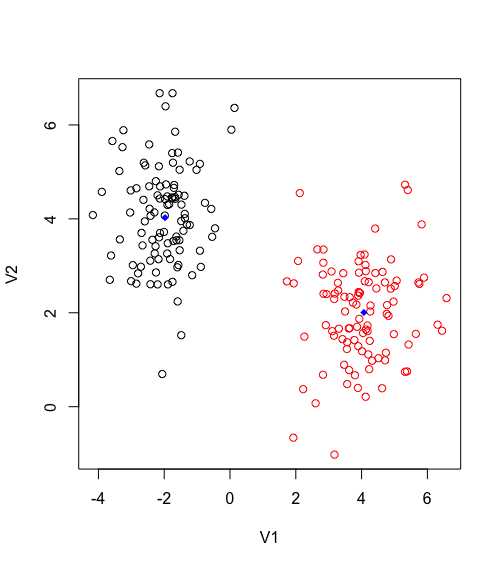
distances <- as.data.frame(distances)By plotting the results we get the following. Blue dots reflect the centroids_points. It is obvious how the distance function is grouping each observation based on the proximity to the centroid.
Now the rest of the algorithm is rather trivial, to update the centroid is the mean of each cluster, this will allow the centroid to move towards the center of its grouped observation, and then regroup new observations.
prev_centroids <- df[centroids,]
  for( i in 1:iter){

    centroid_coords <- sapply(1:k, function(i,df,cluster) colMeans(df[cluster==i,]), df, cluster)
    centroids_points <- matrix( rep(as.vector(t(centroid_coords)),each=nrow(df)),nrow=nrow(df))

    if(all(prev_centroids == centroid_coords)){
      print(sprintf("Converge point, mean is no longer changing after %d iteration", i))
      break
    }
    for(i in 1:k) {
      to <- i*p
      distances[,i] <- euclideanDist(df,centroids_points[,from[i]:to])
    }
    for(i in 1:k) {
      cluster[which(distances[,i]==apply(distances,1,min))]<-i
    }
    prev_centroids <- centroid_coords

  }
So here there are two condition for the algorithm to finally finish. Either the centroid are converging which mean there is no change between the last centroid and the current, or the maximum iteration has been reached.
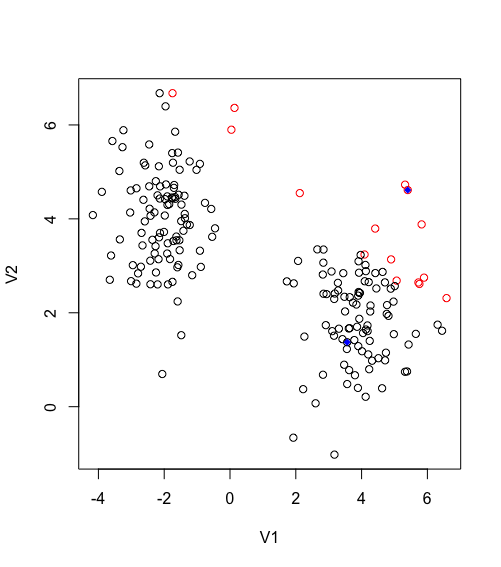
Second iteration of Kmeans
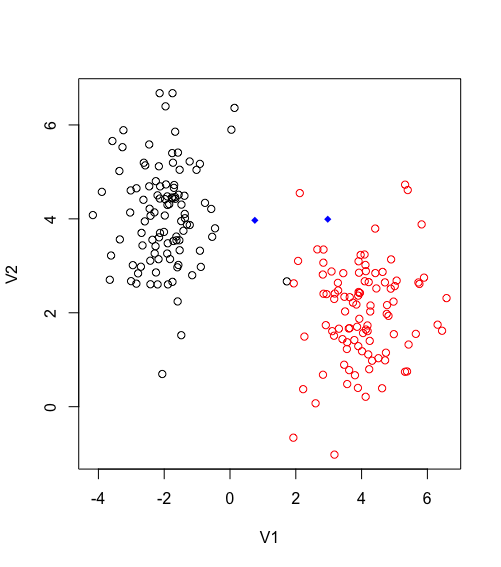
Third iteration of Kmeans finally converge