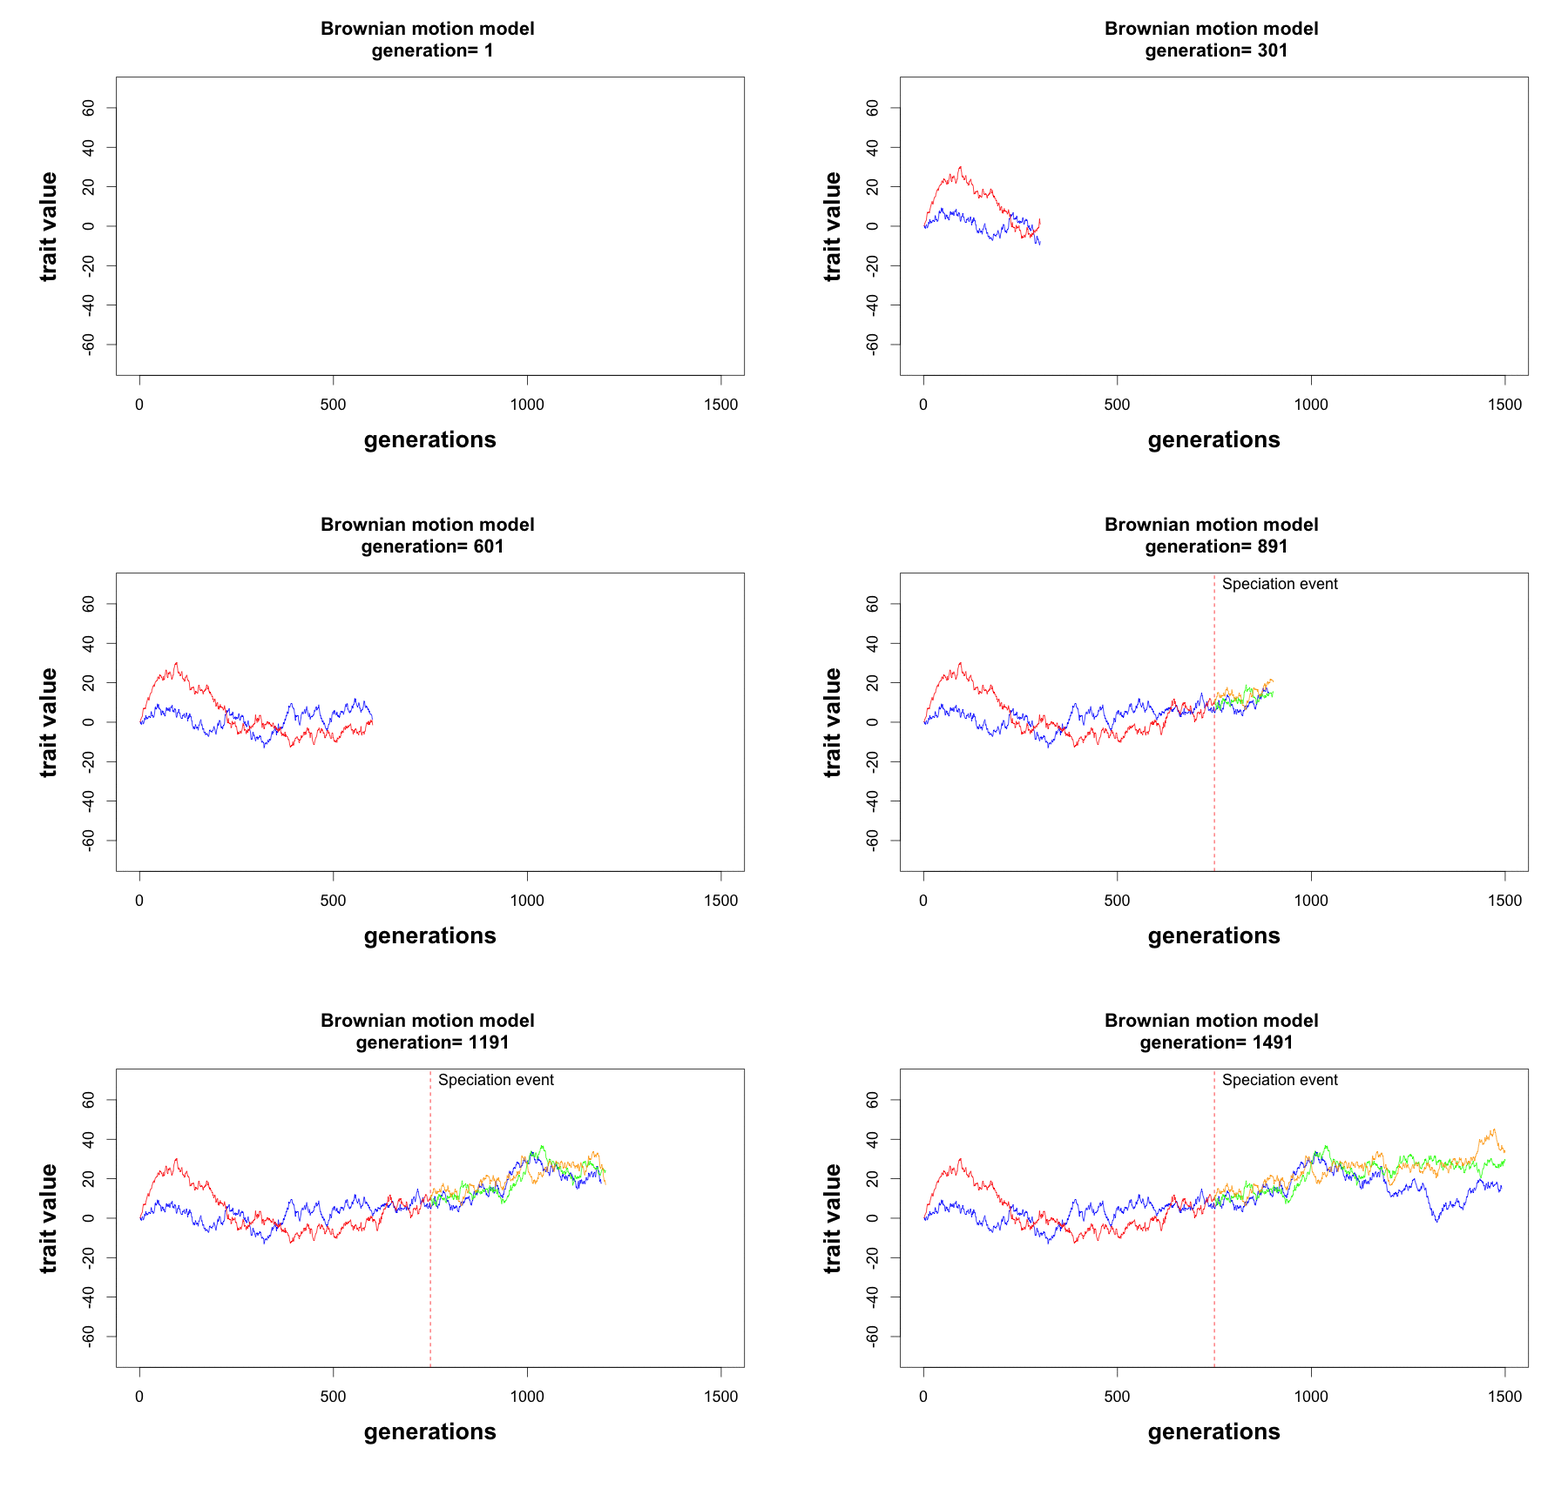
Wiener process animated GIF with R
An easy look into animation with R by simulating Brownian motion and creating a GIF in a few steps. This post is based on Javi Fernandez Post “Brownian Motion GIF with R and ImageMagick”.
This is a modify version with a refactor functions to generate the simulated process and some minor fixes, but the overall process keeps the same core idea.
Let’s explore the concept of what Brownian motion is? Basically is the random motion of particles suspended in a liquid or gas (not very helpful right), there is an interesting story into how it came to be discovered by botanist Robert Brown and later describe by Einstein, but that is away from the scope of this humble post.
How the simulation works?
Well basically it uses the rnom function to mimic the randomness of the motion, in fact I could argue that the proper title should be Wiener Process instead of Brownian motion as it explained more the core part of the data frame that is generated, although both of those term are correlated nonetheless. Here is a snipted of the functions that randomly generate data frame of motion:
generate_random_process <- function(from, to, initial_y_value = 0) {
  df <- data.frame(Y = initial_y_value, X = 0)
  y <- initial_y_value
  for (g in from:to) {
    df[g - initial_y_value, 2] <- g
    df[g - initial_y_value, 1] <- y
    y <- y + rnorm(1, 0, 1)
  }
  return (df)
}
Simple enough the core idea is to create a dataframe with a size of values such that by calling generate_random_process(0,5) would output:
| X | Y |
|---|---|
| 1.49975518 | 1 |
| 0.35771348 | 2 |
| 0.58231513 | 3 |
| -0.01806287 | 4 |
| -1.07139526 | 5 |
Then is just a matter of plotting this simple X,Y coordinates into an R plot. A function to plotting all of the process showMotion illustrate how to do it. But the goal is to create an animated gif so instead the procedure involves generated a set of images that will draw each process per step and save it.
parp <- rep(0:1, times=7, each= 15)
parp<- c(parp, rep(0, 1290))
speciation_event_pnt = 750

for (q in seq(1,1500,10)) {
    id <- sprintf("%04d", q)
    png(paste("bm",id,".png", sep=""), width=900, height=570, units="px", pointsize=18)
    par(omd = c(.05, 1, .05, 1))

    plot(0, 0, ylim=c(-70,70), xlim=c(0,1500), cex=0,
         main=paste("Brownian motion model \n generation=", q) ,
         xlab="generations", ylab="trait value", font.lab=2, cex.lab=1.5 )
    lines(df2$X[1:q],df2$Y[1:q], col="blue", lwd=1)
    lines(df1$X[1:q],df1$Y[1:q], col="red", lwd=1)
    lines(df3$X[1:q],df3$Y[1:q], col="green", lwd=1)
    lines(df4$X[1:q],df4$Y[1:q], col="orange", lwd=1)

    if (parp[q]==0 && q > speciation_event_pnt) {
      text(920, 70,labels="Speciation event", cex= 1, col="black", font=1)
      abline(v = 750, col="red", lwd=1, lty=2)
    }
    dev.off()
}
Last but not least we paste this using the command “convert” from imagemagick tool.
system("convert -delay 10 *.png bm.gif ")Et voila! the result look like this:
